USD a Sick Puppy?

Hell NO, USD is a sick Rottweiller, not a puppy! This currency behemoth is shedding value faster than you can say “the greater depression”!

Currently staring into the abyss, USD should find support here-abouts at the 61.8% fib retrace, but keep in mind this is a retest of the June lows and there is a whole swag of sloshy USD’s in the system. All indicators are weak and this powerful down channel isn’t letting go easily.

USD’s chart seems a perfect example of fiat currency destruction, robbing USD holders of their purchasing power as the US continues it’s successful exportation of inflation. Whoa betide the linked currencies, especially the powerless trading currencies as they conversely rise.
USD

USPOG looks toppy here

I’m always wary of a rising DOW and rising USPOG; it’s a sign of excess USD money in the system looking for a home, confirmed by continued falling USD as it devalues. Right now though, USPOG has a toppy look about it, turning over perhaps. Downside should be a small decline back to the 50MA and anotehr shot upwards to again try for $1000. Continued decline in USD will help this along and there’s plenty to suggest USD is staring into an abyss. Will humungous vested interests be enough to prop up USD? Probably.
USPOG

$NZ Price of Gold; Thin end of the Wedge

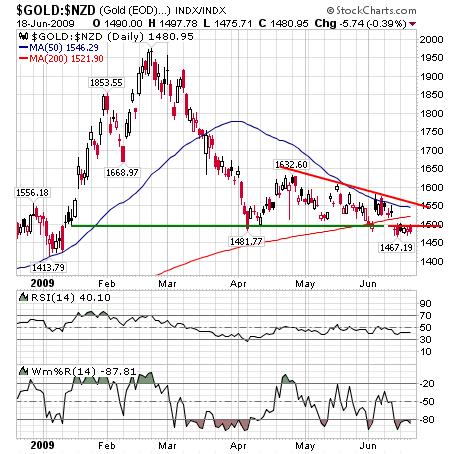
Gold in $NZD continues working it’s way into the thin end of a large wedge formation, moving sideways in a very narrow price range, caught between the forex effect of a falling USD, rising NZD and rising $US Gold price (USPOG). This is NOT price action, this is a sleeping tonic. Yawn.
NZPOG

Free newletter; Elliottwave.com

Try this free email newsletter, if you like it join Club EWI or subscribe to one of their many excellent publications. I find it and their subscription services to be a very useful to balance the perma bulls views that proliferate on the internet. You don’t have to believe it per se, but you’d be foolish not to take it into account. JMHO.

Elliottwave.com free newsletter

Try this also, their Club for FREE e-books and reports, well worth the investment … especially for bugs, their FREE 40 page Gold & Silver e-book

NZ Price of Silver

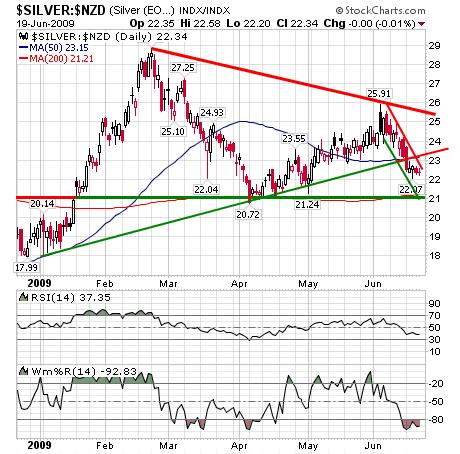
NZPOS is pretty ugly like NZPOG, being hammered by the rapidly rising and persistently high NZD negating much of teh rises and USPOS and accentuating the falls. Currently NZPOS prices are working their way down in a narrow channel, but beneath its 50MA and what was hoped by some to be a strong rising support trendline, but wasn’t!

Bullish? While there’s little to be bullish about except maybe the oversold %R and weak RSI, you’ll be wanting NZD Silver to somehow bust back up through all that resistance which only sis days ago was supposed to be support, then above that is the solid declising trendline resistance from the Feb’09 high. Silver bulls are fearless and they resolutely believe, heck they know this will happen 😉

Bearish? Well it’s easy to be negative on NZPOS right now with nothing below here except the 200MA and horizontal support at $21, which when broken would open up a collpase to $20 and decline to $18 after that. Accumulators will be wading in already but any sign of prices below $20 and it’ll be “back up the truck and load her up” 🙂

nzpos 190609

USPOS

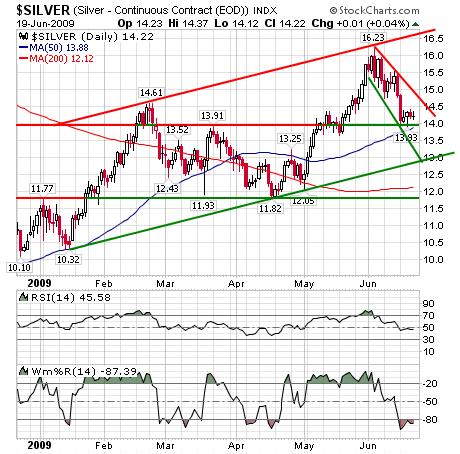
A quick update of the chart and we can clearly see Silver is midstream in a massive parallel rising channel and has bounced rather fortuitously on horizontal support at $14. Still hovering above its 50MA, and with decent support below, the Silver chart has some cause for confidence in price strength, but those pesky indicators offer no suggestion of direction from here.

Bullish? You’ll be looking for Silver t owork itself out to the declining resistance trendline and break out up, at $14.5

Bearish? You’ll be wanting a slump through the 50MA and horizontal support, and to continue down teh declining pennant formation to test the major support trendline currenrly at $13

uzpos 190609

NZ Price of Gold

So how does it translate into NZ price of Gold? Well, not that good actually. The persistent strength in the USD has pushed NZD up from the .40’s to the .60’s, a ~20% change which has sucked teh life out of any Gold price rallies and compunded Gold price declines. NZPOG currently is in an ugly declining wedge and looks set to test the horizontal support around $1413. The current ST channel shows NZPOG fell through it’s 200MA and tried to get back, but sagged. Again like USPOG, the indicators aren’t very helpful with NZPOG’s %R holding in oversold and RSI weak and staying there. The good news is that Gold can be bought with NZD’s at over $500 cheaper than in February. How quickly we forget that the NZPOG low was $575 not so long ago.

nzpog 190609

Gold

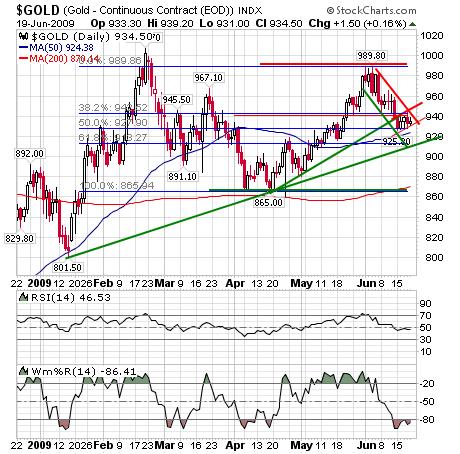
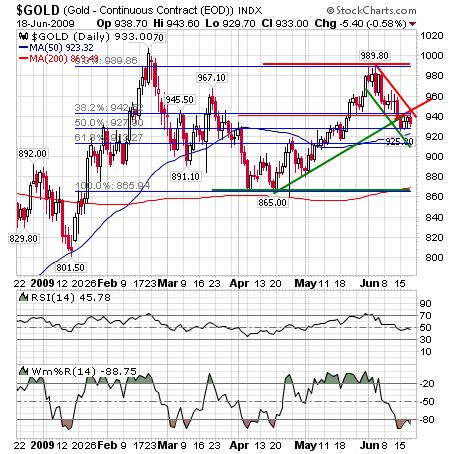
The US Price of Gold (USPOG) looks a little more promising when you step back from it a bit, as the chart illustrates the underlying supprot trendline from Jan’09 which crosses right on that 61.8% fib at $912. It would be a concern for the bulls to see Gold fall beneath there, but you can also see the solid shelf of support at $865 and again at $800. While %R is holding in over sold, RSI is meekly tracking sideways in neutral ground. There is no real indication of direction evident in these. A plan either way is always the best approach and now is a good example of why. While the promise of an uber breakout of the huge Head & Shoulders formation going back to Mar’08 is exciting for bulls, the promise of a wave (C) down to the $600’s is exciting for accumulators. uspog 190609

USPOG Weekly Summary

Concluding a somewhat tedious week, USPOG responded to Monday’s collapse down to the 50% fib retrace and low volatility in the USD, with a 4 day dose of sideways price movement. Was it all boring? Maybe not.

Looking at the zoomed-in chart segment below, we can clearly see current prices are still set within a well formed short term down trending channel, however this past week of sideways prices actually ground out a slight parallel rising channel as the price worked it’s way into the larger resistance trendline.

Bullish? You will be looking for Gold to break out of this immediate resistance, setting up for a retest of the $955-$965 region where the price tends to either bolt up, or collapse down from.

Bearish? A turn back from the immediate resistance trendline would bring the confluence of support at $927, the 50MA and 50% fib into play, though $912 at the 61.8% fib is the logical support beneath that.

uspog zoom 190609

NZPOS

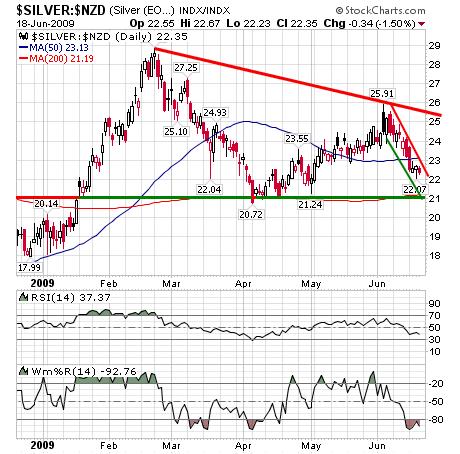
NZPOS seems determiend to seek out the floor of support at $21 (also the 200MA) and there by negating the entire price move since the Feb’09 breakout upwards. Caught in a steep declining ST trend channel, which is within a broad descending wedge, NZPOS can draw some comfort that this is a continuation pattern. Indicators are languishing. This setup informs accumulators that relatively good physical metal buying can be had here and below.

nzpos 180609

NZPOG 180609

The NZPOG chart illustrates the sideways price action of the past three months; the volatility in USD and USPOG keeping a lid on, and a platform under NZPOG. The whole picture is still of a rising trend with remarkable symmetry in trendlines.

At present NZPOG is working into a shallow descending wedge with horizontal support at $1480 and pivoting on teh 38.2% fib from Jul07 to Feb09. MA’s 50 and 200 are converging, MACD illustrates this also and RSI is uninspiring hovering under 50.

A breakdown at support would probably follow through to the 50% fib at $1400, with solid support at $1300 and again at $1100. Accumulators will be looking for metal at these and lower prices.

A bounce on support and push up through the 50MA would bring stiff resistance into play at around $1600. This requires a rising USPOG and a more stable USD.

nzpog 190609

Why use TA for NZPOG?

This came up in discussion about why would we use chart analysis for the price of Gold in NZD? I think there are three important points;

1. Measuring the price of gold in NZD (NZPOG)
2. Using the language of TA to describe NZPOG
3. Applying trading analysis

For 1. NZPOG, is important to anyone who buys and sells in NZ currency, to keep tabs on the price in NZD. This is the same regardless of what the asset, service or product might be. This helps us to figure out whether we are buying or selling at a price relative to a previous high or low and factor that into a conclusion of whether it is a good, ok, or bad price. It’s a number that gives a perspective of value relative to historical price for buyers or sellers using NZD’s.

For 2. TA of NZPOG helps because it introduces all sorts of other indications of whether the price is a good, ok or bad price relative to your own ability, timeliness and cash to participate. On the other hand the language of TA is born out of trading and it is illusory in that it implies forces that don’t exist or that play out as a by-product of other primary forces. To help illustrate this, the price of gold in NZD is not set buy the buyers and sellers of gold who use NZD to do it. The price is a factor of NZD relationship to the USD of which Gold price is set in (or Pounds). This is helpful only as a buyer or seller using NZD, and TA helps to inform a view of when to act in buying or selling.

For 3. Trading analysis of the metal is useful in the markets that the metal is actually traded in, and that’s done largely on paper (etf, options, futures). The reality is that very little actual metal physically moves between counterparties as a result of a trade, but sometimes it does. It is not inconceivable that people and businesses in NZ pay for metal trade done in USD with NZD’s. What trading analysis is not helpful for is the reason a person might want to have some metal, which is more akin to insurance than investment, let alone trading in the sense of ST profit gains short or long. It is very helpful for buying for inventory, or selling mined metal.

My point is that if you use NZD to participate in buying or selling precious metals, or in fact any asset class, the value of any one particular measure or method of reason for getting into, staying in, or getting out of precious metals can be questioned in isolation; however a combination of all relevant knowledge and skills, and the ability to apply them would be ideal. To buy and sell using NZD’s and not to monitor the price and circumstance of ones holdings in the currencies that one is forced to consider and use is illogical.

USPOG 180609

USPOG bounced nicely on the 50% fib retrace from April’s low to June’s high; back testing the trendline previously support but now resistance, and at convergence with the 38.2% fib. Still contained within the narrow short term declining trend channel, USPOG should either move up out of the channel at $940 setting up a potential bear trap, or falter at $940 and continue down to test primary support at $870. The psychological resistance / support at $900 should distract, though not neccessarily stop a down move.

What do you think of the smaller chart format?

USPOG wedged between fibs

USPOG wedged between fibs